Yield Mapping: How to See the Real Productivity of a Field
Yield is often assessed after harvest: the grain is weighed, divided by the field area, and the average yield per field is calculated. For general reporting, this may be enough. For field management, it is not.
Average yield shows the final result, but it does not explain how that result was formed. It does not answer the key questions: which part of the field generated the main return, where yield consistently declines, which zones respond to fertilization, and where additional inputs fail to deliver the expected return.
This is why yield mapping is becoming one of the most important tools in precision agriculture. It allows a field to be seen not as one uniform boundary, but as a system of different zones with different productivity levels, potential, and limitations.
For this purpose, FRENDT uses FarmTRX – a retrofit yield monitoring and mapping system that can be installed on combine harvesters of different brands, models, and years of manufacture. The manufacturer positions FarmTRX as a system for collecting real-time data on yield and grain moisture and creating automated yield maps for each field.
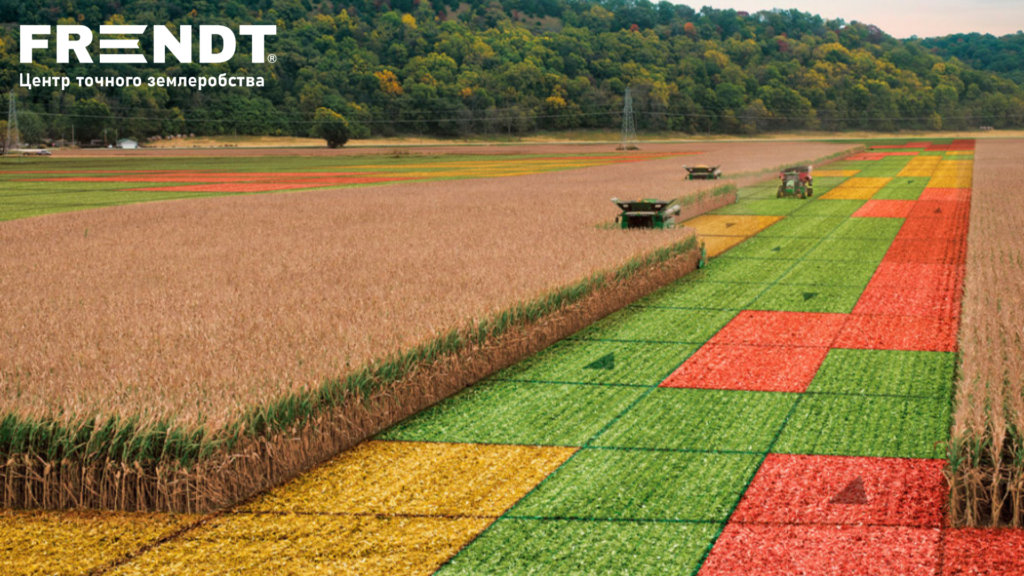
A Yield Map Is More Than Just a Colored Visualization
At first glance, a yield map may seem simple: green areas indicate higher performance, yellow areas show average results, and red areas show lower yields. However, the real value of such a map is not in the colors, but in the spatial reference of the result.
The map shows how much yield was obtained in different parts of the field during harvesting. It is created using data from yield sensors, moisture sensors, the header position sensor, and GPS.
A field may show an average yield of 8 t/ha, while within that average there may be zones producing 10 t/ha and zones producing 5 t/ha. If a farm looks only at the average figure, it sees the overall result. If it looks at the map, it sees the structure behind that result. And real management begins precisely where this structure becomes visible.
Why It Is Difficult to Assess the True Effectiveness of Technology Without Yield Mapping
A farm may use high-quality seed, modern machinery, RTK navigation, soil analysis, prescription maps, and a well-designed nutrition system. But if there is no yield map after harvest, one question remains open: where exactly did the technology work, and where did it not?
Yield mapping makes it possible to compare the final result with previous decisions. For example:
- where higher fertilizer rates were applied;
- where seeding density was changed;
- where deep ripping was carried out;
- where a different preceding crop was grown;
- where the field had issues with compaction or moisture;
- where different hybrids or varieties were used.
Without a yield map, such conclusions are often based on impressions. With a yield map, they are based on actual data.
At the same time, yield maps can be useful for forecasting yield potential and the variability of soil nutrient supply in future management decisions. However, data quality depends on proper installation, calibration, and maintenance of the system.
In other words, a yield map does not simply record the past season. It helps plan the next one more effectively.
How Yield Maps Become Management Decisions
After harvest, a yield map should not remain an archived file. It should become a working tool. It can be used in several key areas.
1. Defining Productivity Zones
A yield map allows the field to be divided into high-performing, average, and problem zones. This is the basis for zone-based management, where each part of the field receives not the same technology, but an approach aligned with its actual potential.
2. Evaluating the Effectiveness of Technological Decisions
If a farm has tested different fertilizer rates, hybrids, seeding densities, or soil tillage practices, the yield map shows where these decisions delivered results – and where they did not.
3. Preparing for Variable Rate Application
Yield maps can serve as one of the data layers for creating prescription maps. They help determine where it is worth intensifying the technology and where increasing inputs may not be justified until the limiting factor has been addressed.
4. Identifying the Causes of Losses
If a certain zone consistently underperforms, it becomes a signal for deeper analysis: checking the soil, compaction, acidity, drainage, relief, and the quality of field operations.
5. Evaluating Field Economics
A yield map is the first step toward a profitability map. When seed, fertilizer, crop protection products, fuel, land rent, and logistics costs are added to yield data, the farm can see not only where it harvested more, but where it actually earned more.
And these are often not the same thing.
Yield Mapping: Why the “Average Figure” No Longer Works
Today, mistakes in agribusiness are more expensive than ever. Rising prices for fertilizers, fuel, and logistics have turned working with an “average field” into a dangerous luxury. The average approach is deceptive: it masks unprofitable zones and hides the true potential of productive areas.
Yield mapping is a tool that moves agronomy from the realm of assumptions into the realm of measurable data. Often, a field is considered “weak”, when in reality only a quarter of it is problematic. Or the opposite: a field that appears visually stable may conceal zones that consume resources year after year without returning the investment.
From Data to Decisions
The main value of the technology is not in the colorful image on the monitor, but in the specific steps taken after harvest:
Accurate zoning: dividing the field into areas based on real productivity.
Cause analysis: understanding why one part of the field is underperforming – whether due to nutrient issues, relief, or machinery-related factors.
Cost optimization: creating prescription maps for variable rate fertilizer application.
Thanks to solutions such as FarmTRX, yield mapping becomes accessible to farms of different sizes and machinery fleets. The system can be installed on existing combine harvesters, even when machines of different brands operate in the same field. This makes it possible to synchronize data and obtain a complete picture of yield and grain moisture in real time.